Dr. Amit Kapoor presented the first report of their initiative India Cluster Mapping, titled “Clusters: The Drivers of Competitiveness” to Dr. Bibek Debroy.
It is divided into two main sections:
- The first section traces the evolution of clusters and portrays how their role has changed over the years; provides comparable cluster definitions. This will help in understanding the ways by which clusters affect competition and regional competitiveness.
- The section section defines the clusters for the Indian economy and analyses their performance. This analysis is conducted for the period 1999-2014 using Annual Survey of Industries data on the organised manufacturing sector. According to the cluster definitions, based on the clustering algorithm generated by Delgado, Porter & Stern, there are 51 traded and 16 local clusters categories. It also tests the relationship between clusters, innovative capacity, competitiveness and economic performance.
The main findings from the report include:
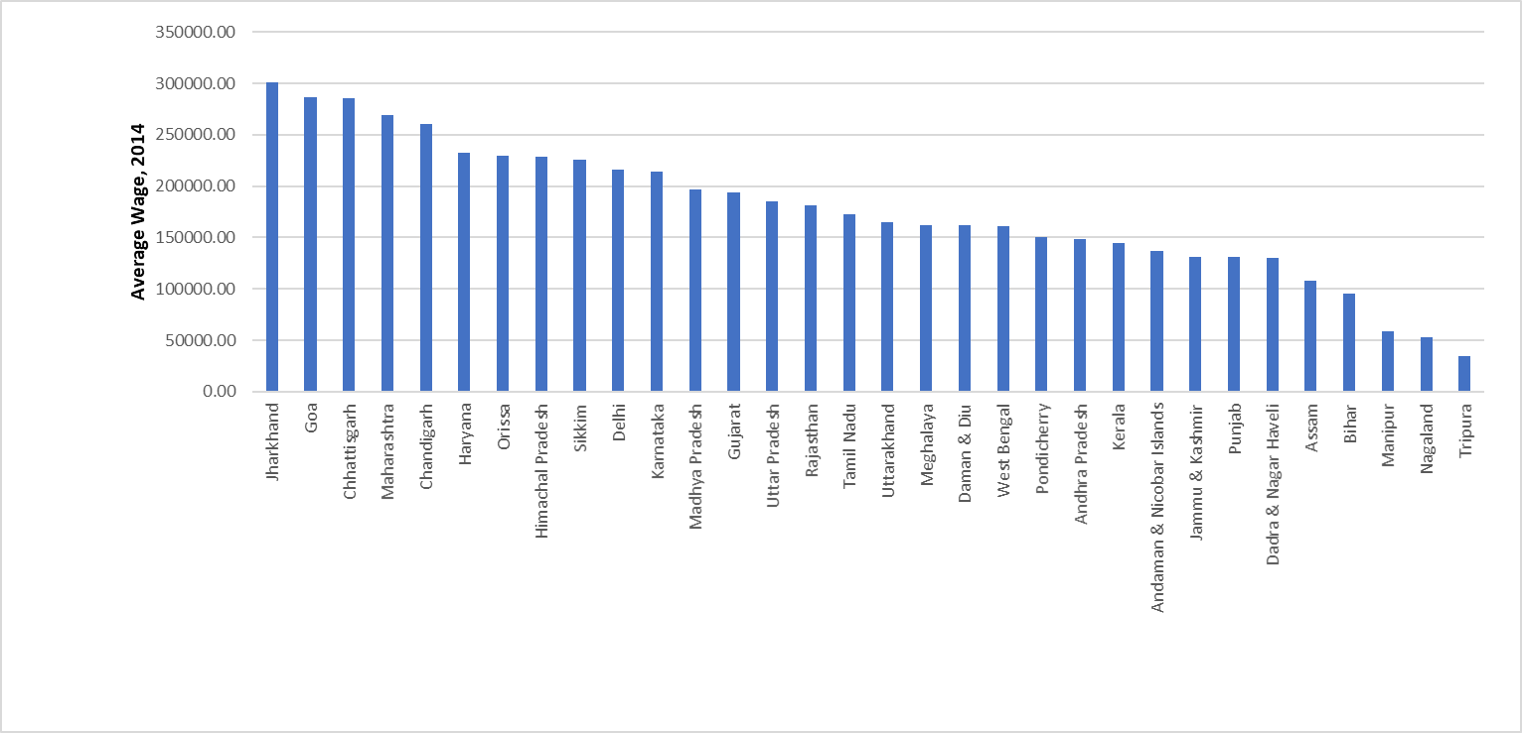
- Regions vary significantly in terms of average wages and employment levels. The average wage of the highest earning state (Jharkhand) is nine times that of the poorest one (Tripura).

- Average wages in industrial states like Tamil Nadu (Rs.1,73,000) and Andhra Pradesh (Rs.1,48,181) fall below the national average wage (Rs.1,76,677). The employment and wage scenario in these states reveals that even though they are known for some high-paying sectors (Automobiles in Tamil Nadu and Pharmaceuticals in Andhra Pradesh), most of the workers are employed in low-paying sectors like Food Processing, Textile Manufacturing, etc.
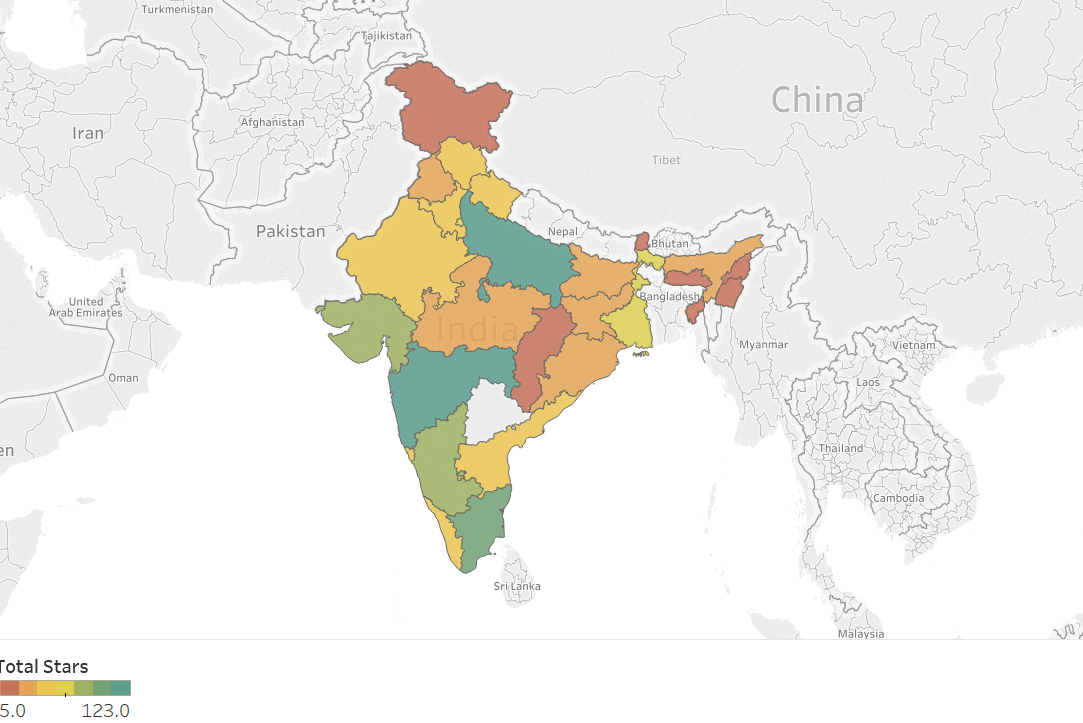
- Southern states have a stronger cluster profile than the rest of the country. The image below shows the cluster strength of regions based on star methodology. The overall performance of a cluster is measured across four dimensions – specialization, size, productivity, dynamism. A star is assigned for each of the four dimensions to the regions that are in top 20 percent. As there are around 31 regions that are considered for this study a star is assigned to 6 regions in each dimension for every cluster category. For instance, if Maharashtra is in top 20 percent of the regions by employment for Automotive Cluster, it will be assigned one star, and Automotive will be a one-star cluster in Maharashtra. But if for the same cluster it lies in the top 20 percent regions by location quotient then it will get two stars. Being in the top 20 percent regions for the same cluster by productivity and dynamism will earn Maharashtra four stars. The strength of a region’s cluster portfolio is measured by summing up the performance across its individual clusters. For instance, if a state has four one-star clusters, seven two-star clusters, four three-star clusters and five four-star clusters, then the total stars that the state gets are 4*1 + 7*2 + 4*3 + 5*4, i.e., 50.

- Traded clusters vary significantly in terms of employment, employment generation, average wages, and wage growth. The average wages in high-tech clusters, defined by Aerospace Vehicles and Defence, Biopharmaceuticals, Communication Equipment and Services, Information Technology and Analytical Instruments and Medical Devices, is higher than the average wages in other clusters by Rs.1,13,322.
- High-tech clusters don’t have a strong impact on the regional economy. The proportion of high-tech employment explains 6 percent of the variation in average wages and 7.6 percent of the variation in average wages of local clusters. It is also observed that there does not exist a significant relationship between the high-tech clusters and employment growth. This helps us in concluding that for enhancing productivity states should focus on upgrading the clusters that are already present in the region.
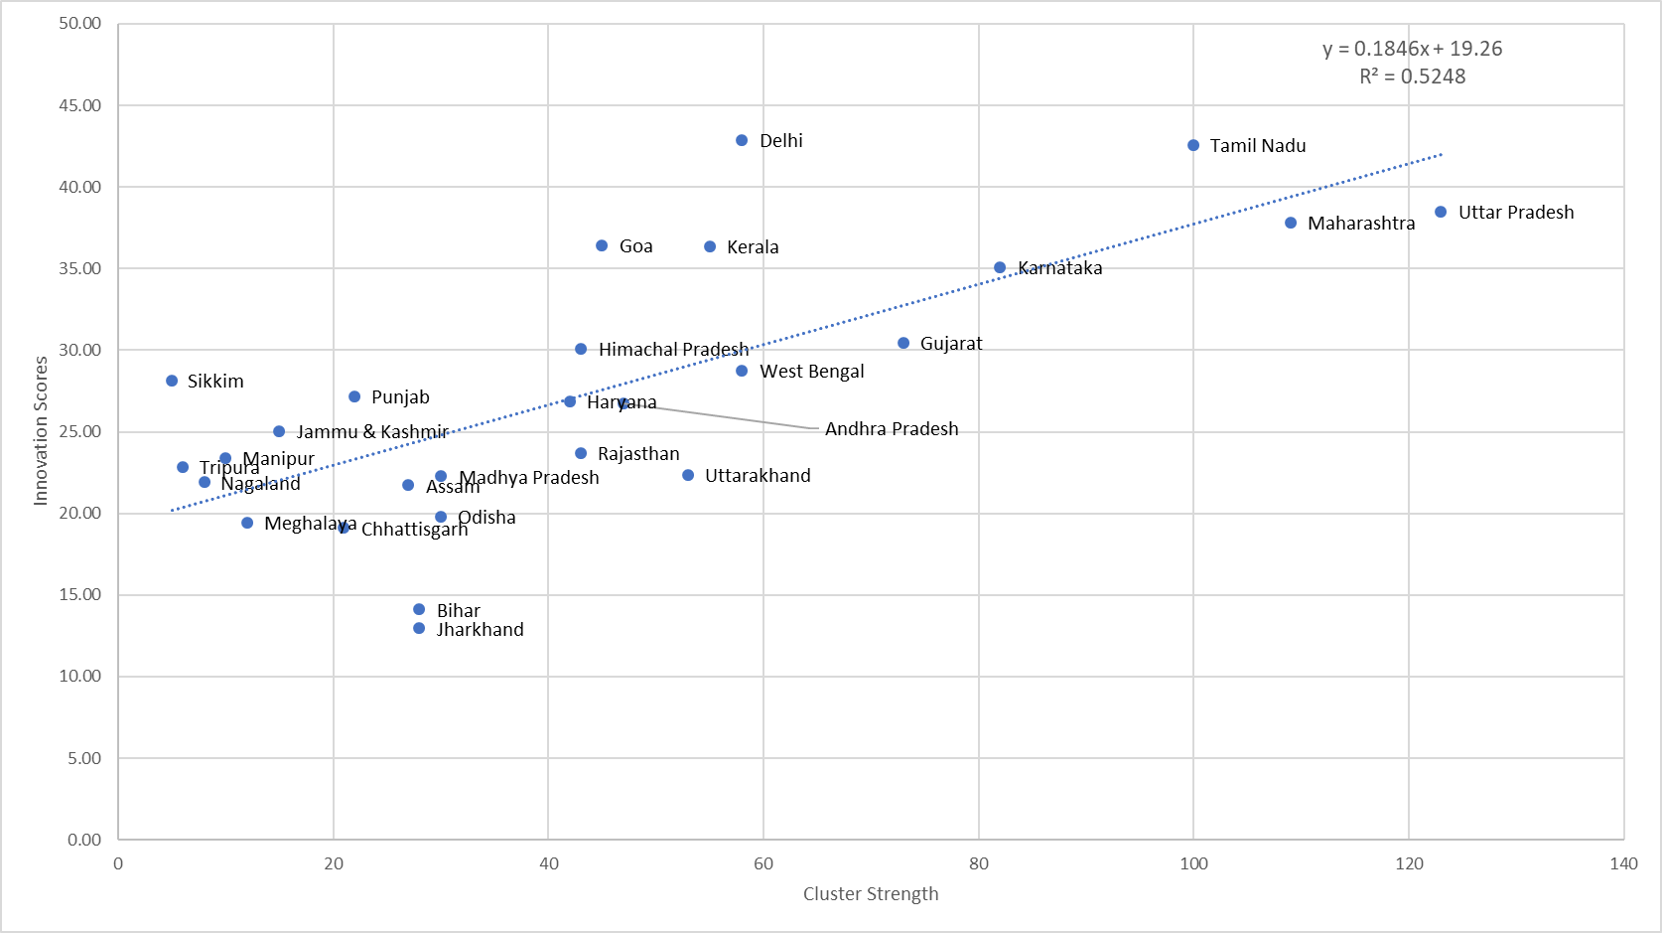
- States with strong cluster portfolios perform better on innovation backing the theory that clusters provide an environment conducive to innovation and knowledge creation. These states are also ranked high on competitiveness.

Read the Report

